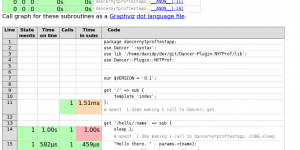
Today I released Dancer::Plugin::NYTProf, which provides easy profiling for Dancer apps, powered by the venerable Devel::NYTProf.
Using it is simple – load the plugin in your app:
use Dancer::Plugin::NYTProf;Then, use your app as normal, then, to view the profile data, point your browser to /nytprof (e.g. http://localhost:3000/nytprof, and you’ll get a list of profile runs (each request is profiled individually):
Select the profile run you wish to view, and nytprofhtml will be invoked behind the scenes to generate the HTML reports, which will then be served up, and you’ll be looking at the helpful Devel::NYTProf reports, to see where time was spent processing your request:
Early days yet, and a lot of room for improvement, but in my testing, it works.
Things I’d like to add when time permits:
- The ability to exclude Dancer internals from the profiling (if I can find a clean way to do so)
- The ability to enable profiling only for certain requests – for instance, providing a pattern to match the request URLs you want to profile
- The ability to customise the URL at which profiling reports are served up
- Check for sane behaviour if prefixes are in use
Feedback welcome!


One word: **AWESOME** :)
Thanks Pedro :)